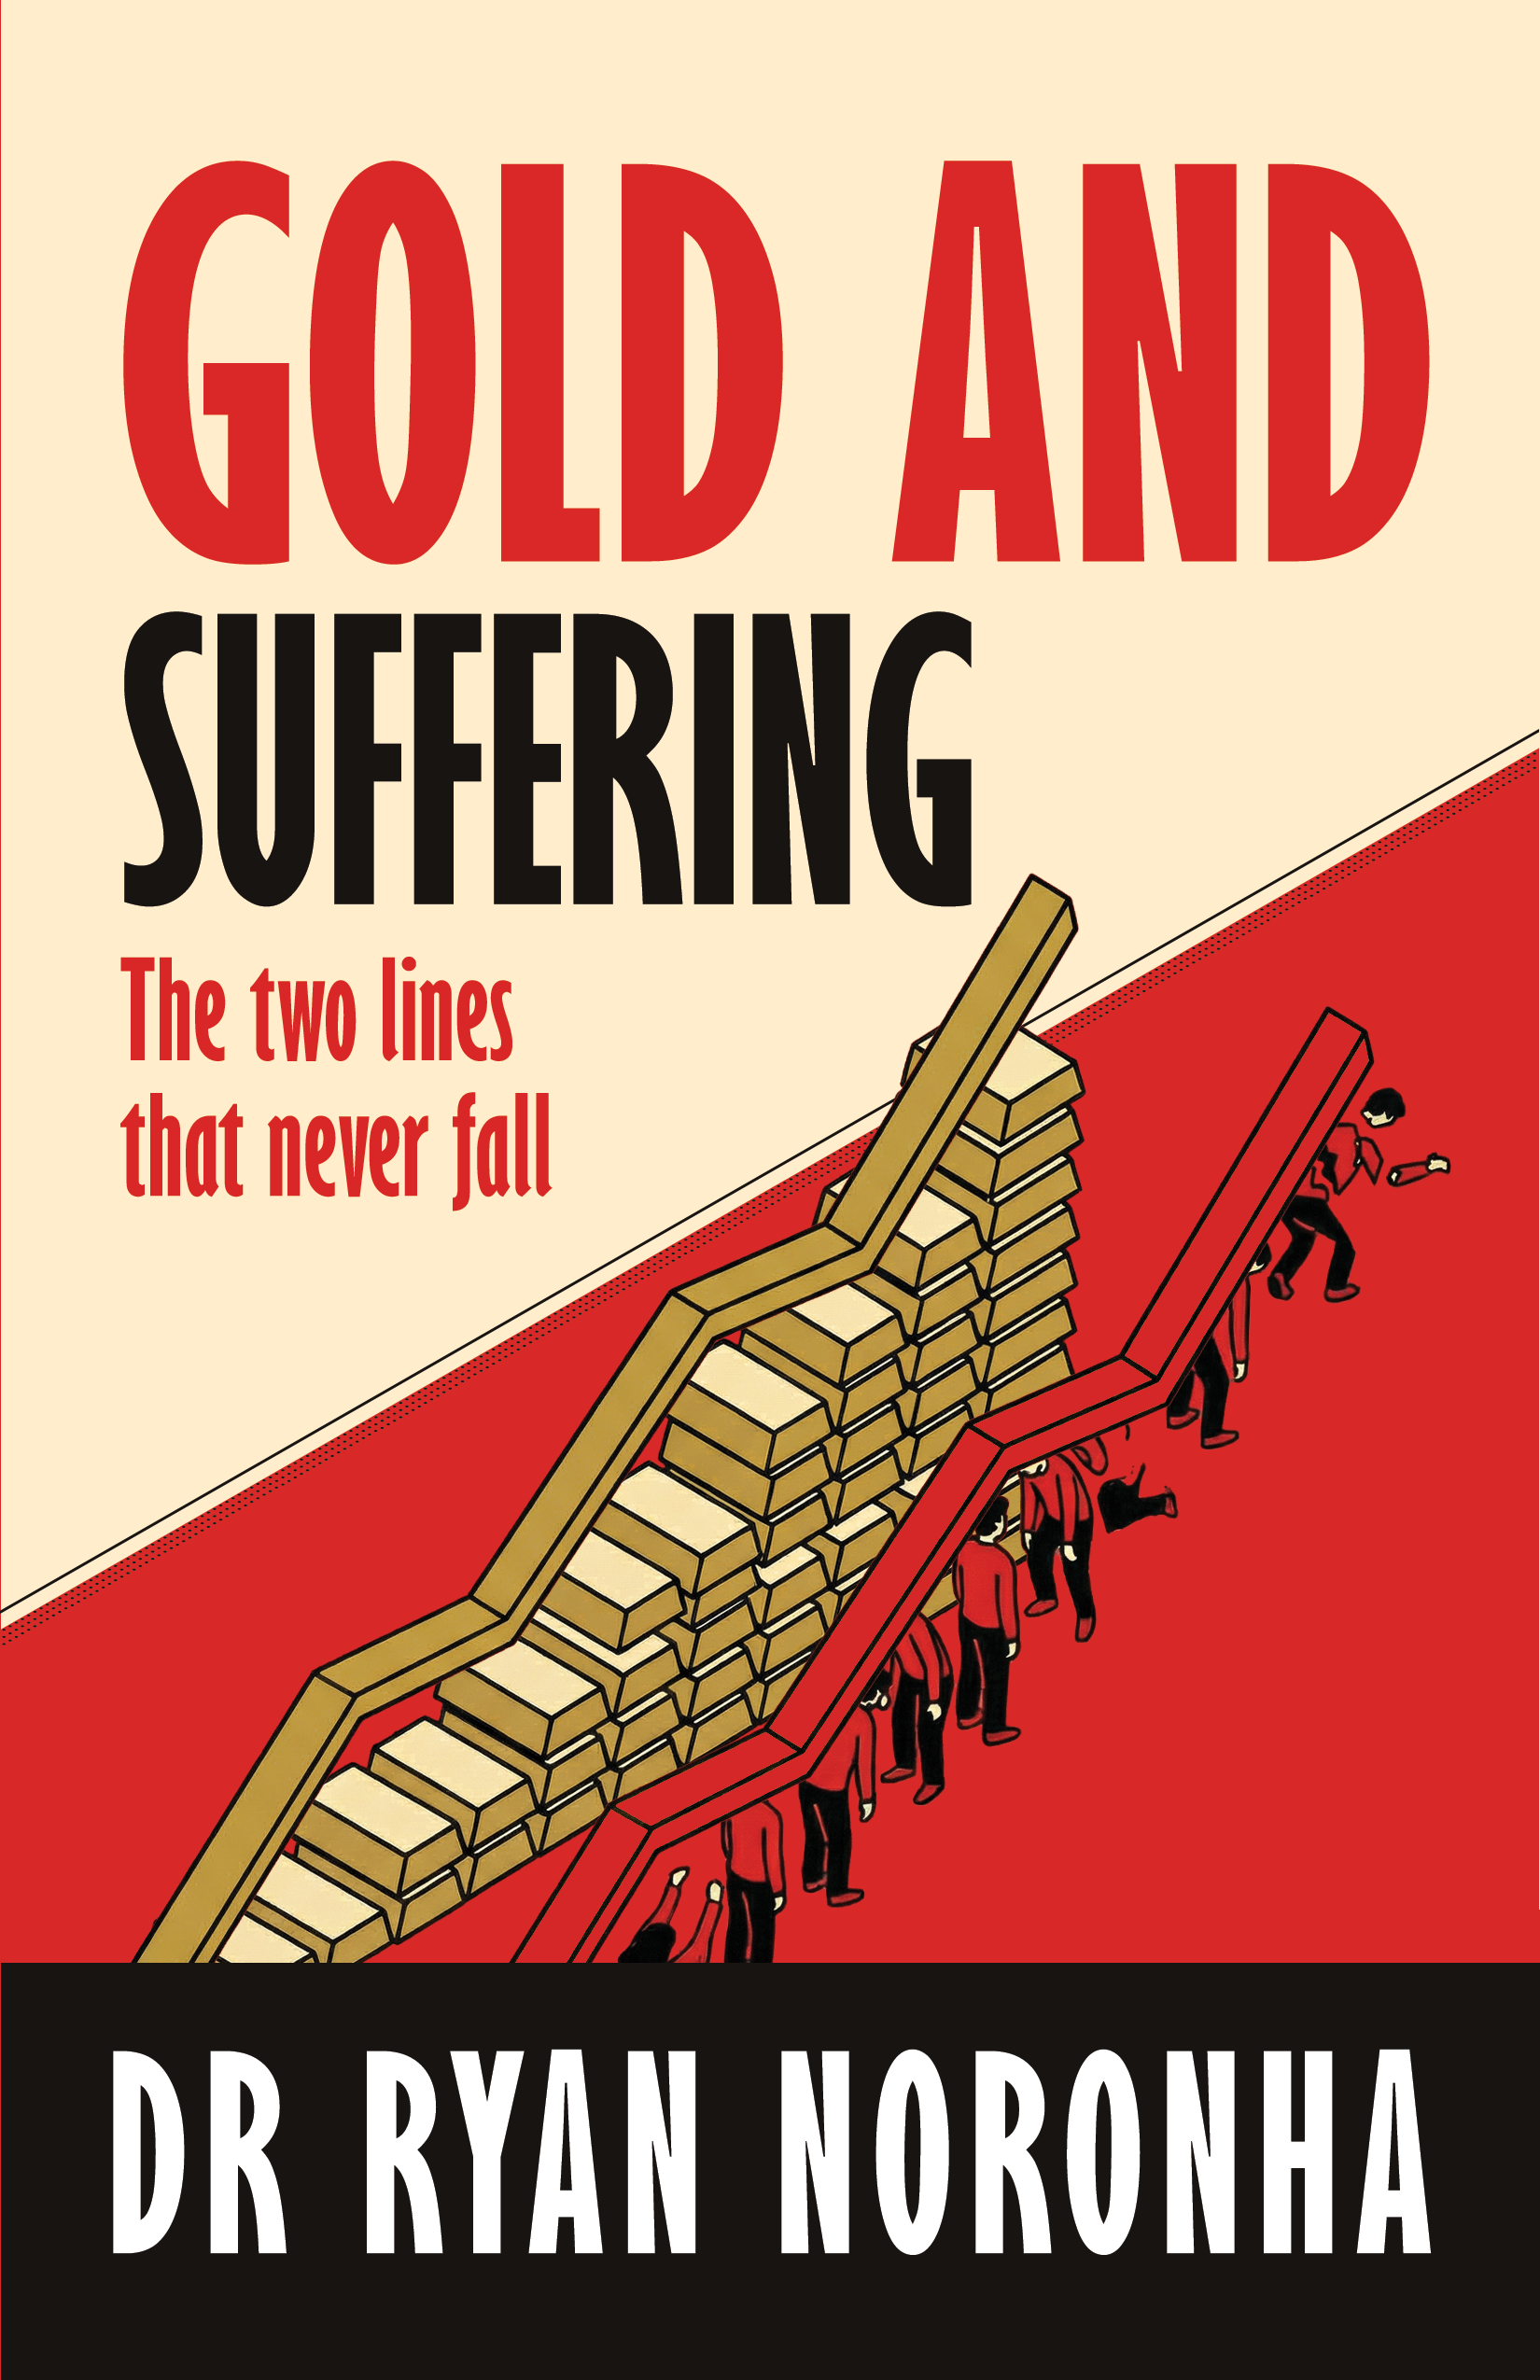
FREE TO READ
GOLD AND SUFFERING
The two lines that never fall
TWO LINES. ONE GRAPH. ONE QUESTION.
Free, complete and unabridged. No email required. EPUB is the better read on a phone or e-reader.
FREE TO READ
The two lines that never fall
TWO LINES. ONE GRAPH. ONE QUESTION.
Free, complete and unabridged. No email required. EPUB is the better read on a phone or e-reader.
Central banks are accumulating gold at the fastest rate in recorded history. Repatriating it. Buying it in vaults. And some of it is simply disappearing, moved off sovereign balance sheets into private hands that answer to no electorate. The line goes up and never comes down.
Depression is now the leading cause of disability worldwide. Food bank usage has risen from 26,000 parcels to 2.5 million in fifteen years. NHS excess deaths linked to austerity exceed 300,000. The line goes up and never comes down.
One line measures what the system accumulates. The other measures what it costs. They have moved in the same direction for four centuries. Nobody puts them on the same graph.
THIS BOOK PUTS THEM ON THE SAME GRAPH.
Gold and Suffering tracks two civilisational metrics across the same timeline and asks the question the data makes unavoidable: what if the suffering is not a side effect of the system but the fuel?
The lines never fall. Now you see why.
Every figure in this book is public. Every source is listed at the back so you can check the working.
Where the evidence went against the argument, it stayed on the page rather than being buried: four of the five series have turned down from their peaks in the last three years, and the central graph the book was built around failed its own arithmetic test and had to be rebuilt.
It reads in about an hour.
Dr Ryan Noronha is writing a series on the same architecture at longer range: how it was built, who maintains it, and who pays for it. Books are landing through the year.
The book’s method note promises that its argument does not depend on hidden information, only on placing familiar numbers beside one another. This page is where you check that.
Every quantitative claim in the book is traced in its Ledger to a source, a table and a date. What follows is the same material organised for the web, with links to the issuing institution wherever one exists, so that a reader who wants to test a figure can reach the original in one click rather than taking my word for it.
Figures are frozen at the data freeze of August 2026. Where a series has been revised since drafting, the revised figure is the one used in the book, and the earlier figure is recorded in the Ledger.
If a claim here cannot be traced to its source, the claim is wrong, and I would like to know.
A note on what this list is not. It is not a claim that the authors below agree with the book’s argument. Several would reject it. Case and Deaton would likely resist the use made of their construct; the researchers who dispute the austerity mortality estimates are listed alongside those who produced them. The list is the evidence base, not a coalition.
The book distinguishes three kinds of claim: what the data shows, what can reasonably be inferred from it, and what remains speculation. This page supports the first.
Four bounding decisions were fixed before the data was assembled: the window under examination, whose gold is counted, whose suffering is measured, and whether the second line is one series or four. Those bounds are stated in the book’s method note and held throughout.
The book’s central graph was built twice. Common-base indexing was tested at three base years and failed: gold cannot be indexed to a year in which the official sector was a net seller, near-zero bases inflate two of the series beyond usefulness, and one series changes direction depending on which base is chosen. That failure is documented in Chapter 8 and the workings are published, because a method that can flip a line’s direction by moving its starting point is not a method.
Four of the five series have turned down from their peaks in the last three years, and one fell by statute rather than by need. All five movements are stated in the chapters where they belong.
Last updated: August 2026